Candlestick ChartFree Candlestick Chart
The chart is called candlestick chart because the main body of the chart representing prices looks like a candlestick. On the diagram you can see that the thick body is red when the sellers are winning in that session while the thick body is blue when the buyers are winning the battle in that session. The line extending above and below are called shadows. Lower and upper shadows. The top of the shadow is the high of that session and the bottom of the lower shadow is the low price of that session. So in analyzing a candlestick chart, you can visually tell which batch of traders are winning. Buyers or Sellers. You always want to be doing what the winning team is doing. There are different kinds of charts. The Candlestick chart is my choice of forex chart. Almost all charts I look at today are candlestick charts. There are very few traders who still use the bar charts or other chart forms today. All the brokers I have traded with, provided a free candlestick chart software to their traders. So the simplest form of a trading software has a chart software that is free. So you can get your free candlestick chart from any forex broker. Below is an example of the free candlestick chart from my broker. I have chosen blue and red colors for my candles. Blue is when the buyers are winning and red is when the sellers are winning. You might see white and black or some other colors. It does not matter. You can always change the colors on your charts. It is that simple. This chart is a 15 minute time frame chart, you can adjust it to anytime frame allowed on your trading chart software. Click here for clearer picture
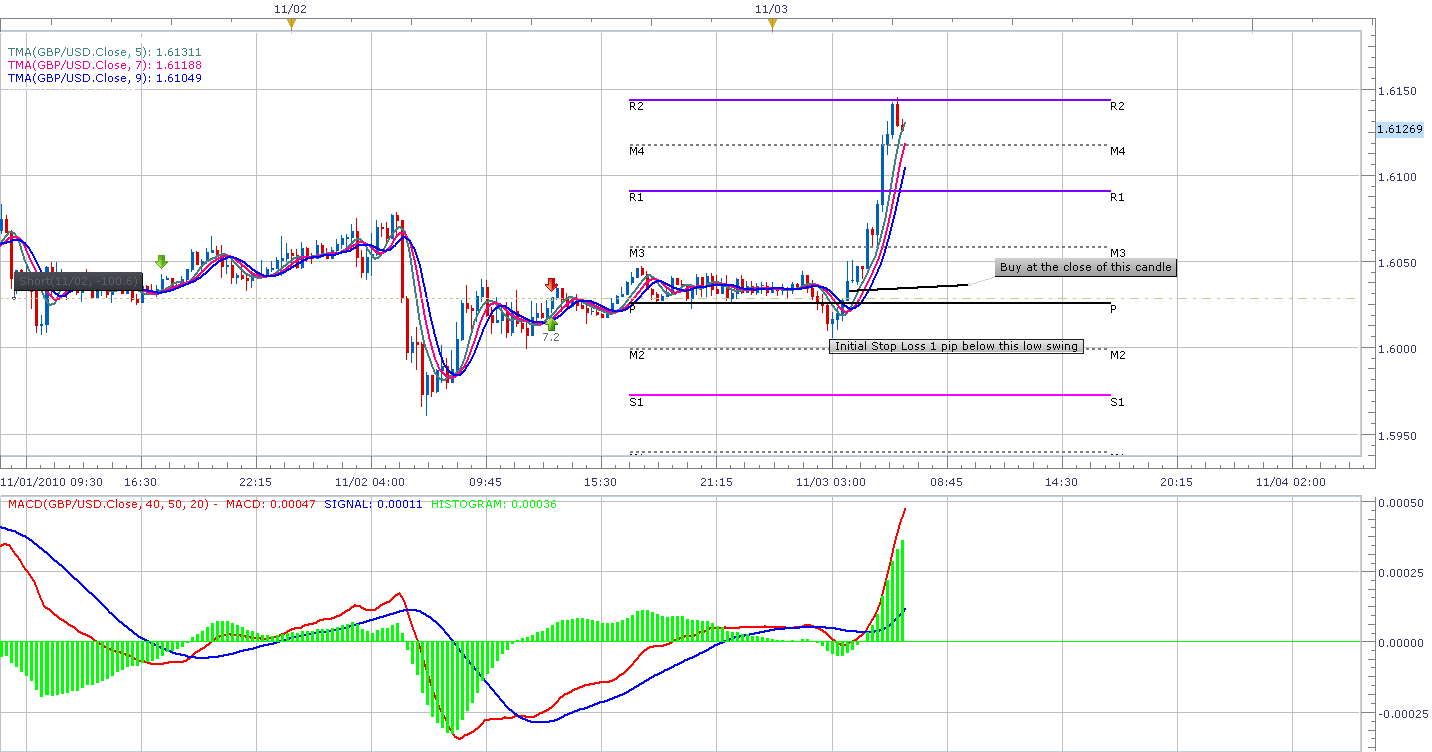
Candlestick Chart SoftwareCandlestick chart software are mostly free from brokers. However, there are specialized charting services with specific chart software. You can subscribe to this services if you want too. In my opinion, there is really not much you can gain from these services, because I keep my trading simple and my free candlestick chart package from my broker is pretty comprehensive. So do your own research, if you need specialized chart services, then you can subscribe to some of them. I do not use specialized candlestick chart software, so I don't have much to say about the candlestick chart specialized services. You can open a free demo account with my broker. They are good, I can say, because after working with a few brokers, I really have settled with. My software from my broker has everything a trader need from a chart to trade successfully. If you are new to forex and yet to settle for a broker, then I can recommend my broker, they are good. You can open a free forex trading account here and test the software for yourself and see if you are comfortable with the charting software. I am very satisfied with the candlestick chart software. Candlestick Chart AnalysisCandlestick chart analysis can help you see what other traders are really upto. The visual strength of the candlestick chart is what makes it so popular. How do you analyze candlestick chartNow that you know what the candlestick chart represents, we can move forward with candlestick chart analysis. Your goal in analyzing the candlestick chart is to help you trade successfully. Since we already know our entry point setup, we are going to use the candlestick chart analysis to help us confirm our trade setup. This will give us an edge over other traders who just focus on using indicators alone. To analyze candlestick chart, we have to learn the various candlestick chart patterns available. These chart patterns have been used for years. Once you are able to identify these chart patterns, you can pin-point and prepare for your entry trades in advance than most traders. This will surely give you an edge. Lets go ahead and look at some of the common candlestick chart patterns and how to incorporate them into our forex trading system. Candlestick Chart PatternsThere are maney candlestick chart patterns discussed by non other than the master of candlestick chart, Steve Nison. Initial stop loss is your insurance as a forex trader. This is an exit strategy that enable you to limit your losses automatically. Small losses is the hallmark of successful traders. So focus on maintaining your initial stop loss as seen on the chart. Never change or move your initial stop loss. See the chart below for an example of buy entry point and an initial stop loss. Click here for clearer picture
*Important tip: Charts don't lie. Never move or change your initial stop loss. It will save you when disaster strike. See the chart below for an example initial stop loss on multiple sell trades. Click here for clearer picture
Forex exit strategy: ConclusionDon't worry about those trade that move far beyond your target point. Stay focus on making consistent profits by following your daily forex exit strategy and the small profits will add up before long. If you use the 15 minute chart, you can get at least two trades pair currency pair. So there are 4 major currency pairs, you can add two crosses. If you take 2 trades, a pair that will mean about 12 trades a day. So you many trades to decide on. Choose the best and your should be fine. Follow your exit strategy. If you came directly to this page from the search engines, then I encourage your to goto Forex Trading Tutorial. Get started with Trading Basics Menu. Forex Trading System
|
Trade live with traders from around the world in this live trading room. There are videos outlining trade set-ups, pre-market video analysis, end-of-week trade sample video, archived trading examples and more.
Start Live Training For The Forex Market Here
|


